Make decisions based on data and gain visibility in real time
The Ploomes Analytics module centralizes reports, KPIs, indicators, and CRM goals in real time to monitor performance, identify bottlenecks, and increase managerial visibility.
.webp)
+3000 companies use Ploomes to optimize their commercial management
Why Ploomes?
Transform data into decisions that drive results
with Ploomes Reports
Faster decisions and
secure, based on data
In real time
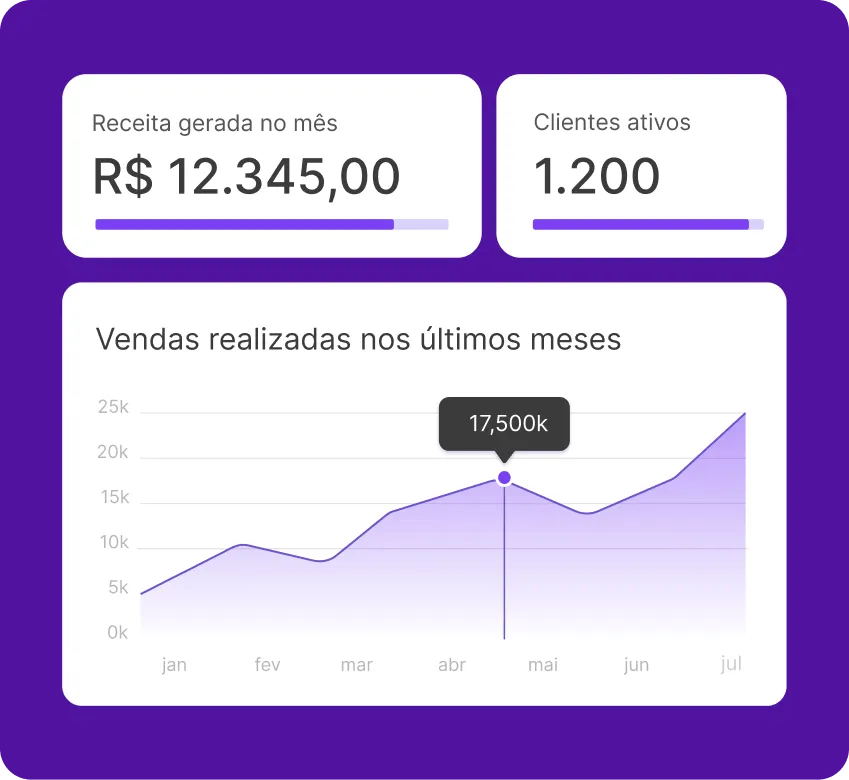
With the Ploomes Analytics module, you eliminate guesswork by following reports with automatically updated KPIs and indicators, with immediate visibility of operation performance and the evolution of goals.
Greater control and predictability of the commercial operation (forecast)
Analyze funnels, processes, and historical data to identify bottlenecks, anticipate risks, and improve the operation's forecast, increasing operational predictability and projecting future scenarios with more confidence.
Freedom to visualize what
It's important
Metrify the results of deals, tasks, products, segments, and sellers using dashboards that you configure in minutes.
Key resources
Features and benefits of the Ploomes Analytics module (Reports)
Have full control over your company's numbers with features that combine analytical depth and ease of visualization:
Management Reports and Dashboards
Build your ideal management vision. Ploomes allows the creation of multiple dashboards and reports with graphs and indicators adaptable to the reality of your company.
Management in sight: Monitor results in real time and increase visibility without relying on manual updates.
Access permissions: Securely define who can view each indicator, ensuring data governance
Goal Management
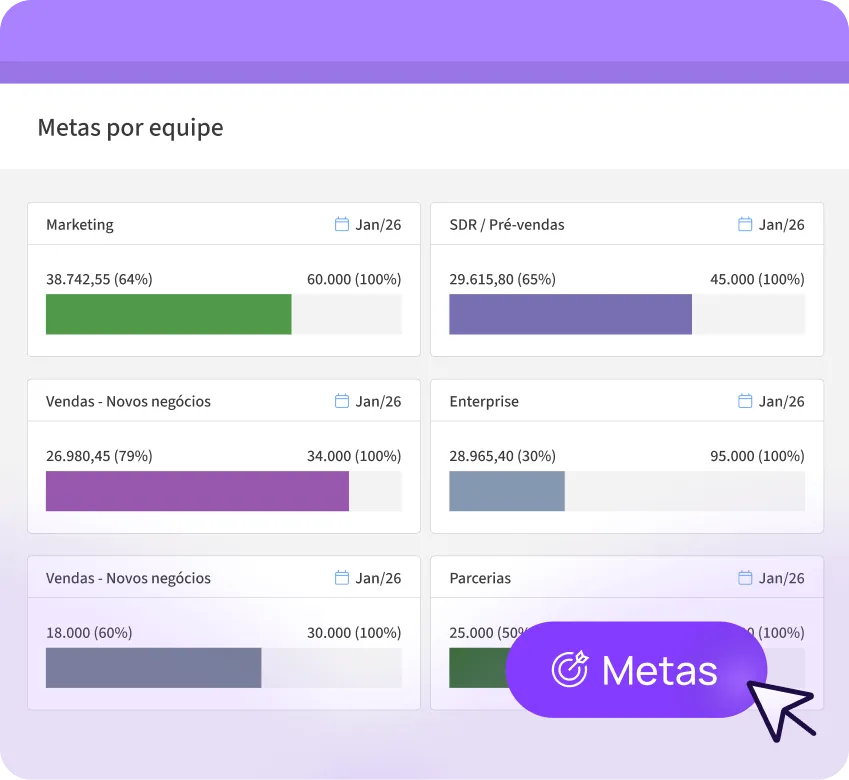
Establish clear objectives and follow the team's evolution day by day with KPIs, indicators and reports of goals. Define the metric (amount or percentage), the desired result, and the calculation period.
Engagement: Keep the team motivated by showing visual progress toward the goal.
Route correction: Identify performance deviations in time to take action and recover the month's result.
Funnels and Process Analysis
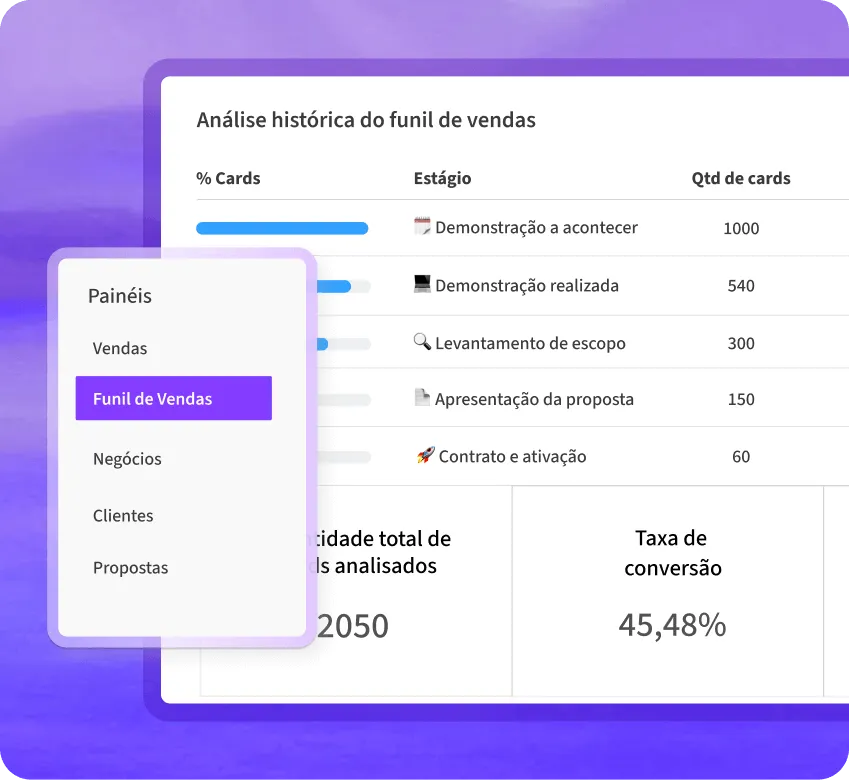
Visualize the health of your sales funnel in a didactic way. Understand current and historical workflow to identify where opportunities for improvement lie.
Managerial Visibility: Find bottlenecks in the process and understand at which stage negotiations are stalled.
Predictability: Use historical data to design future scenarios with greater security.
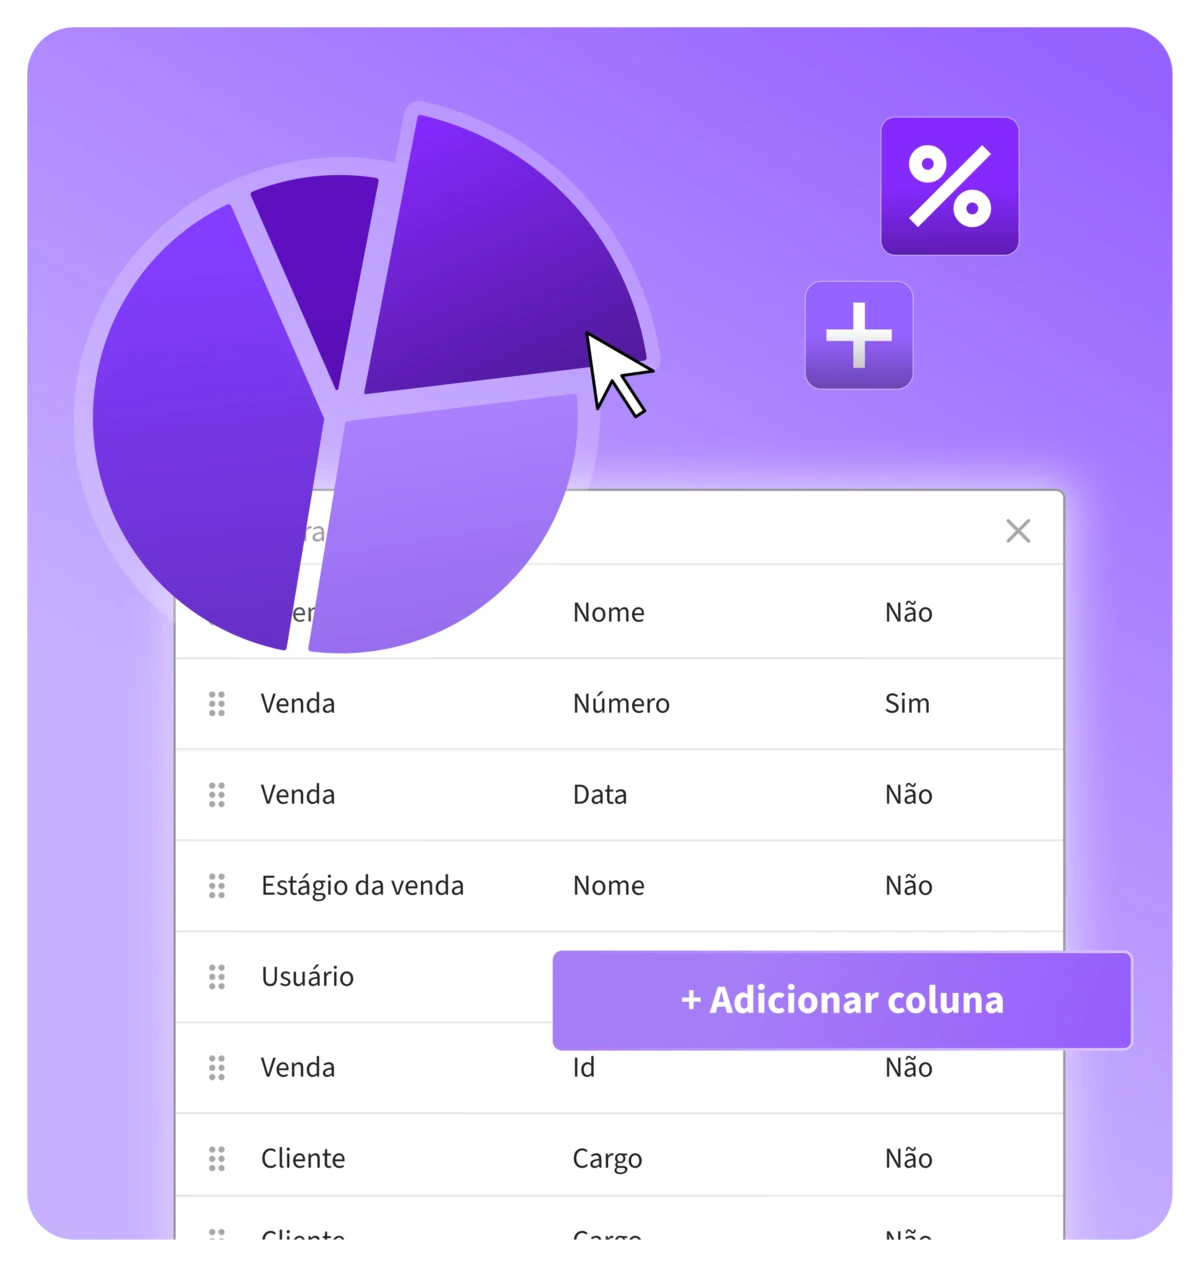
Dynamic Tables
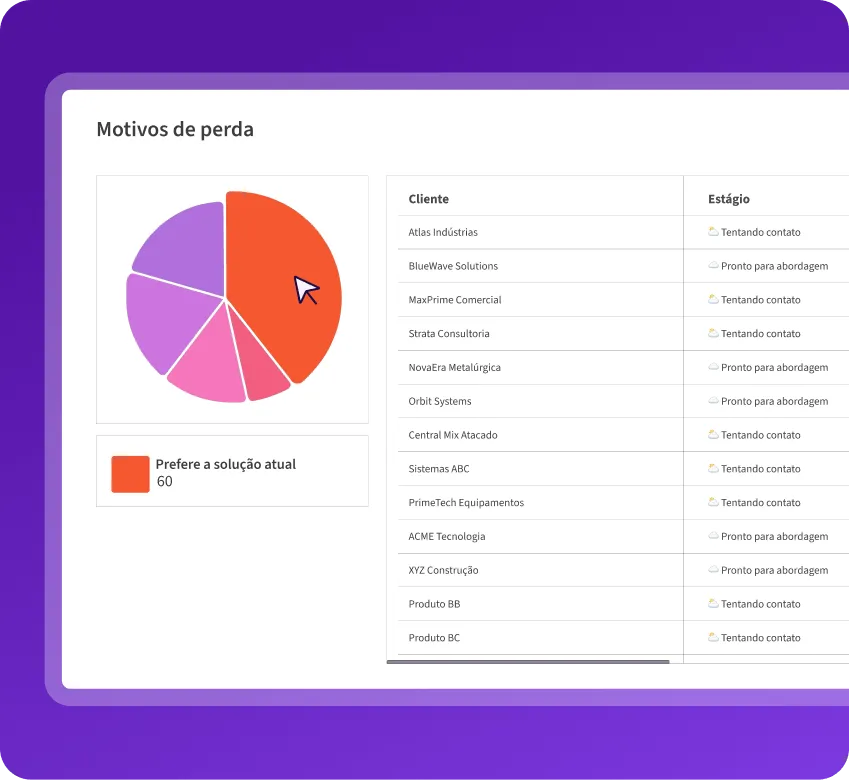
For scenarios that require detail, use tables that consolidate large volumes of information in an organized manner. Cross data from different sources into reports to find specific answers about products, regions, or customer segments.
Analytics Pro
Mais profundidade para
quem precisa ir além
Para operações que precisam analisar grandes volumes de dados e transformar informação em decisão com mais rapidez.
Use o modo apresentação para exibir dashboards em tela expandida, com atualização automática a cada 5 minutos, ideal para telões espalhados pela empresa, reuniões, rotinas de acompanhamento e gestão à vista.
Com o drilldown customizado, você aprofunda a análise dos dados e configura até 15 colunas para investigar detalhes, identificar padrões e encontrar gargalos com muito mais clareza.
Monte gráficos a partir de operações matemáticas entre métricas e acompanhe indicadores calculados de forma mais estratégica, de acordo com a lógica do seu negócio.
additional modules
Boost your Ploomes: extra modules for tailor-made growth
Add advanced functionality as your operation evolves, without complication or rework.
Real results
The impact of data-driven management
"With Ploomes, we manage our funnel, opportunities, proposals, documents, and clients all in one place. It’s become the complete solution for our sales."

INTEGRATIONS
Connect your data to the Ploomes ecosystem
For a 360º view, the Analitycs (Reports) module integrates fluidly with your other management tools:
ERPs:
Unify the sales and billing view (integrated with Sankhya, Omie, Protheus, and others).
Spreadsheets and Legacy:
Import histories so you don't lose valuable information from previous years.

Real impact
Who is the module for
Analytics (Reports)?
Directors and Managers who seek to replace uncertainty with concrete metrics to lead with confidence and decisions based on data.
Commercial Teams who need clarity about their goals and performance to stay focused on the result.
Growing Companies who require scalable processes and a strong data analysis culture.
services
Implementation and support
from Ploomes CRM

Consultative implementation
You know your processes, us, the technology. Together, we implement Ploomes with support and training. Our multidisciplinary team is our differential.

Recurrent support
Online chat to clarify questions and give assistance to users. For accounts that require greater proximity, we offer the possibility of contracting premium support with personalized service..

Custom projects
Team made up of business analysts, solution architects and developers, with the function of activating the potential of Ploomes in your company through the development of new integrations, applications and functionalities.
Frequently Asked Questions
Analytics is the CRM data intelligence module for creating reports, monitoring goals, and analyzing indicators (KPIs) in real time. It transforms operation data into management dashboards for data-based decisions and greater operational predictability.
Yes. The system allows you to configure access permissions by profile. For example, a salesperson may see only their own goal, while the manager sees that of the team and the director that of the entire company, ensuring data governance.
The goals and graphs in the reports are continuously fed by everyday actions. You don't have to “update the spreadsheet”; if a sale is closed now, the goal pointer goes up instantly.
Yes. With the flexibility of Ploomes, it is possible to create “Area Goals” and indicator panels and KPIs for other departments that use the tool, centralizing company management.
You can follow indicators such as conversion by stage, volume of opportunities, win rate, sales cycle, performance by seller and evolution of goals, with filters by period, segment, product and region, thus having complete managerial visibility of your operation.
With the centralized view of indicators and targets in real time, it is possible to identify process bottlenecks and performance deviations quickly. This makes it possible to carry out the route correction in time and base the forecast on concrete data of what is happening now and the history of the operation, eliminating assumptions.
The main difference lies in the level of autonomy and personalization. In standard Ploomes, the user has access to pre-configured reports, and with the Analytics module it is possible to create, edit and customize panels and graphs for different types of use.
Do you have other questions? Get in touch
Evolve your commercial management
Be sure to decide based on facts and boost your company's growth.